Letter to Community
Friends of Charlotte Angel Fund:
The purpose of this letter is to report on our activities and provide perspectives on the pre-seed and seed investing environments.
We want to be as supportive as possible of the Charlotte and North Carolina startup ecosystems. Being transparent is one way that we can serve others.
Charlotte Angel Fund (CAF) initiated its activities in late 2013 with the formation of our first fund (CAF I) and admittance of the first 18 members (investors). Our objectives were as follows:
Deliver financial returns to CAF investors in line with industry benchmarks
Increase the number of willing early-stage investors in Charlotte
Be an easy to access source of capital and feedback for Charlotte startups
Provide educational content to CAF members such that their early-stage investment outcomes, whether via CAF or other avenues, have improved odds of success
The objectives begin with the financial returns to investors because the continued availability of early-stage capital is dependent upon positive economic outcomes for the capital providers. While most angel investors have at least some entrepreneurial and community support aims as part of their motivation, if invested capital isn’t returned to investors along with a profit on those investments the angel investment activity will cease. CAF and its members certainly have affinity for the Charlotte community, and startups that come from our city, but first and foremost our investments must have economic merit.
Our Activity
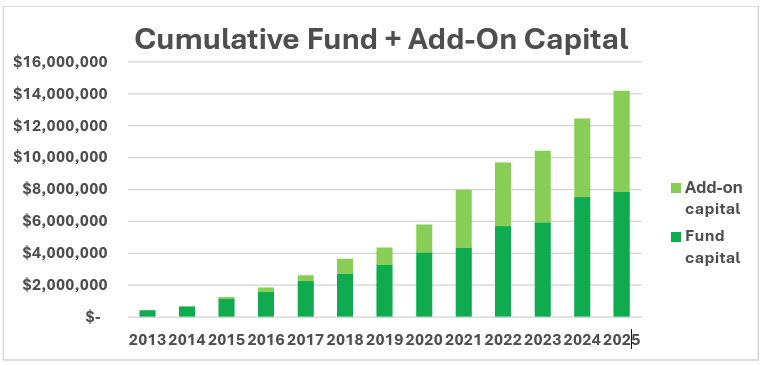
From those modest beginnings in 2013, we have grown to a group of 180 individuals who are participants in one or more of our three funds (CAF I, CAF II, and CAF III). CAF I deployed its capital from 2014 – 2017, CAF II from 2017 – 2023, and CAF III from 2022 to today.
In addition to the fund capital, our members make what we call add-on investments. Those add-on investments are capital that our members deploy on a deal-by-deal basis, dependent upon their interest in that opportunity.
Below you can see how CAF’s cumulative fund capital plus add-on investments will soon cross the $15 million threshold.
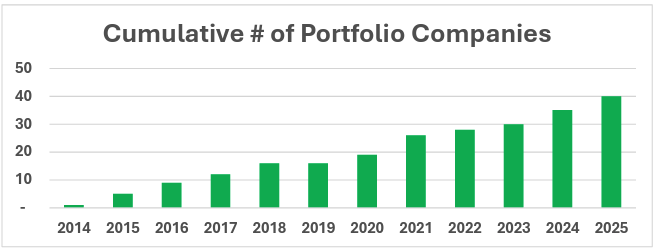
Annual companies added to our portfolio ranged from zero in 2019 to seven in 2021. Overall, we have invested in 40 companies to date.
The table below depicts where our portfolio companies are located. You will see that the two dominant clusters are the Charlotte and Triangle areas of North Carolina.
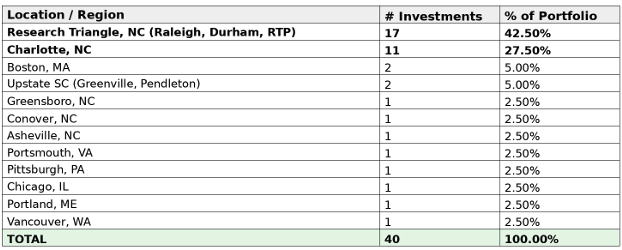
Over time, we have seen an increasing percentage of our investments in Charlotte-based companies, and a decreasing percentage in Carolinas-based companies.
CAF I portfolio: 21% Charlotte, 86% Carolinas
CAF II portfolio: 30% Charlotte, 80% Carolinas
CAF III portfolio: 36% Charlotte, 67% Carolinas
We attribute these trends to a) growth in the startup ecosystem in Charlotte, and b) our relationships with other investors who are more frequently bringing us non-Carolinas deal flow.
Of our 40 portfolio companies, seven have been sold to strategic buyers, one developed a public market for its equity via which we have exited our position, six have ceased operations, and 26 are still active.
Our Returns
The most used metrics to measure a fund’s performance are Distributions to Paid-In Capital (DPI), Total Value to Paid-In Capital (TVPI), and Internal Rate of Return (IRR).
It should be noted that small funds have an inherent performance disadvantage because there is a smaller pool of capital across which to spread certain costs that are relatively fixed, with tax and legal advisors being an example. Community-based angel groups, such as CAF, face this challenge.
Distributions to Paid-In Capital
DPI represents a fund’s cash returns to its investors. Although not technically equivalent, DPI may colloquially be referred to as a cash-on-cash return. A DPI of 1.00 means that distributions to investors are exactly equal to the capital provided by those investors. DPI starts at zero and grows over an early-stage investment fund’s life. With the lengthy time to liquidity events for pre-seed and seed stage investments, it typically takes several years before DPI materializes.
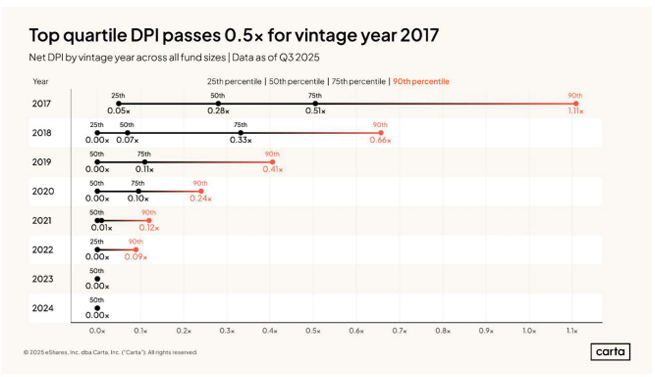
To provide some context, below is data from Carta showing the DPI data for venture capital funds of the 2017 – 2024 vintages. A fund’s vintage is the year in which it was established. For example, for 2017 vintage funds the median DPI is 0.28, with top quartile DPI being anything 0.51 or higher.
CAF I’s (2014-2017) DPI of 1.44x, and CAF II’s (2017-2023) DPI of 0.91x, mean that investors in those funds have received distributions of 144% and 91% of their cash contributions to the funds, respectively. As one would expect for a fund of its age, CAF III (2022-present) has not yet made any distributions to its members.
Total Value to Paid-In Capital
TVPI measures distributions to date, plus the value of the remaining portfolio, as compared to the fund’s capital. When assessing the remaining portfolio, we have been aggressive in reducing the value of companies where we feel that current performance or market conditions warrant a downward adjustment.
At inception the value of the assets is exactly equal to the fund’s capital, resulting in a TVPI of 1.00x. TVPI trends down from 1.00x as the fund incurs expenses from day one, with any increases in portfolio value coming at a much later date. The decrease in value in the early years of a fund is known as the “J-Curve”.
Again from Carta, below we have data for median TVPI figures for venture capital funds of the 2017 – 2023 vintages. For example, a 2017 vintage fund has a median TVPI of 1.76x.
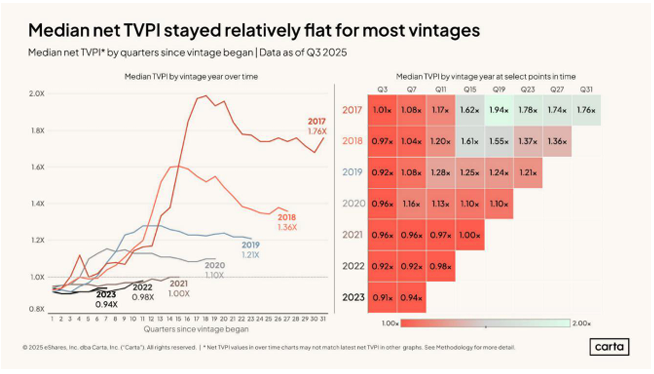
As of 12/31/25, TVPI for the CAF funds is as follows:
CAF I (2015 vintage) 1.67x TVPI
CAF II (2019 vintage) 1.76x TVPI
CAF III (2023 vintage) 0.91x TVPI
Internal Rate of Return
A fund’s IRR represents the annualized return that the fund generates for its investors.
Here is data from Carta, showing median IRR information for venture capital funds of the 2017 - 2023 vintages. For example, a 2017 vintage fund has a median IRR of 10.7%
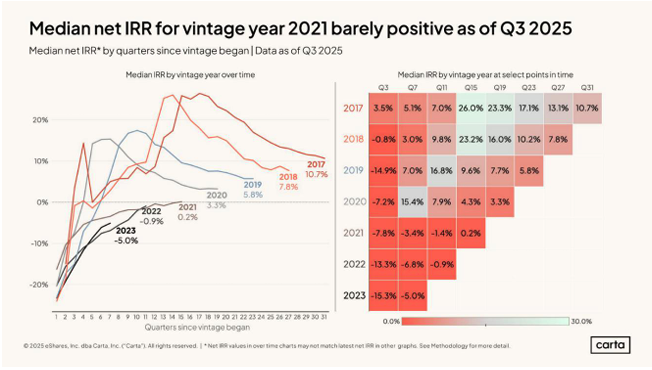
As of 12/31/25, the internal rates of return on our activities were 4.77% for CAF I, 6.92% for CAF II, and 12.50% for the add-on investments made by our members. CAF III is too early to meaningfully assess on this metric.
Summary
CAF and its members are doing well.
We are significantly ahead of benchmarks on the critical DPI metric, meaning that our investors have had a good amount of capital returned to them from our portfolio exits. TVPI and IRR are such that we believe that we are delivering on our objective of appropriate financial returns for our investors.
It should be noted that much of the CAF I and CAF II returns were driven by one portfolio company’s $750 million exit transaction. While outsized outcomes driving the portfolio is the traditional venture capital model, it shouldn’t take an exit of this magnitude to deliver fund returns of the type that we have realized. This reality colors many of the opinions expressed later in this letter
The Environment
This is a challenging time for pre-seed and seed stage investors. Valuations are increasing, liquidity is harder to come by, and investor returns are lackluster.
Valuations
Valuations at the pre-seed and seed stages have never been higher.
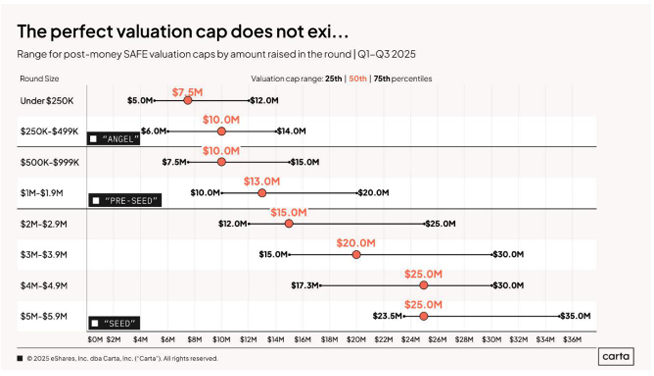
Pre-seed rounds are predominantly done via a Simple Agreement for Future Equity (SAFE) with a valuation cap and no discount. The valuation cap on those is the best measure of the valuation at which the pre-seed investor’s capital is going into the company.
As the data from Carta shows, in the current environment valuations caps of $10M at pre-seed are the norm, with the top quartile of deals being done at $15M - $20M.
This chart shows how valuations for seed stage deals have inflated over time, with median valuations having doubled over the past six years. If nothing else changes, a doubling of the valuation being paid means that the investor’s return on exit will be half of what it would have been without the valuation inflation.
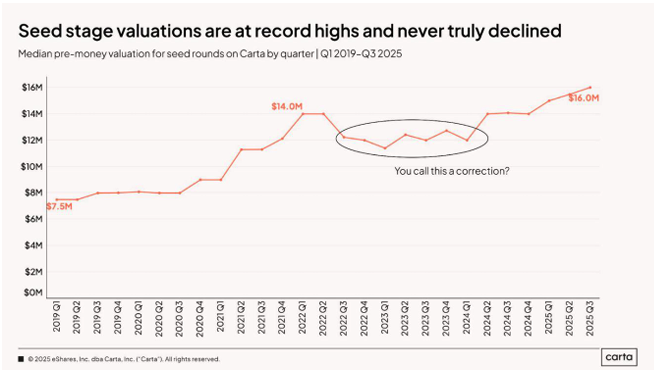
Using the medians, pre-seed is a post-money SAFE at an $11.5M valuation cap, and the seed round at a $16M pre-money valuation. That gives the pre-seed investor a median 39% gain on their pre-seed investment upon the closing of the seed round, with no discount to ensure that there is at least some positive return on all pre-seed investments that reach seed stage. When you consider the relatively high percentage of pre-seed deals that never complete a seed round, the 39% reward for being a pre-seed investor quickly erodes on a portfolio basis.
Our opinions regarding the effect that this is having on the market, and anticipated future impacts, will be discussed in the Impacts section.
Liquidity
The challenges to liquidity are reflected in the industry’s DPI data. Companies are taking longer to exit for a variety of reasons, all of which slows the return of capital to investors.
A 2017 venture capital fund’s medial DPI is 0.28x, meaning that after eight years only $0.28 has been returned in cash for every $1.00 invested. This creates systemic issues as discussed below.
Returns
One can reasonably question whether the median returns achieved by pre-seed and seed investors justify the risk and lack of liquidity.
For emphasis, we again display the median net IRR data for funds of the 2017 – 2023 vintages.
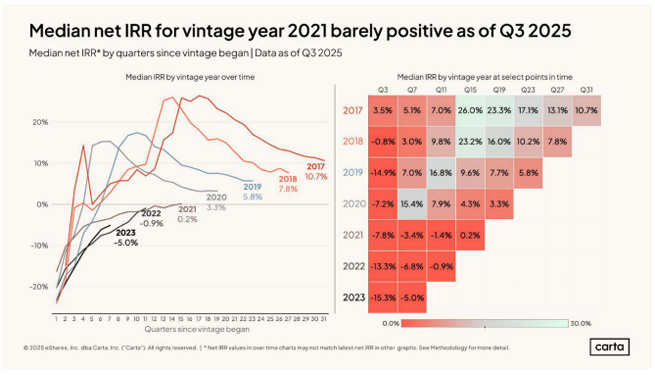
When one looks at this chart and considers that over the past thirty years the average annual return of the S&P 500 is approximately 10%, the financial case for investing in this asset class is not compelling unless one believes that they can surpass the median results.
Having been at this for more than a decade, we’ve seen this market over a reasonable period of time. Were we to make a list of Carolinas-based startups that exited for $50M or more during those years, the list would not be terribly long. Half of that list would probably consist of deals that were never available to CAF or any other angel investment group because the founders had sufficient resources or capital connections to make approaching their local angel investment communities unnecessary. Given the small number of outcomes that can positively influence a fund’s performance, early investment in one of those needs to produce an outsized return.
Impacts
With little reward for investing at pre-seed, when looking at a deal we often find ourselves thinking “perhaps we should just wait for the next round.” If we could eliminate all of pre-seeds early losses and pay only a 39% price increase when participating in the seed round, that might be an attractive alternative. The availability of pre-seed capital would be enhanced if pre-seed deal terms provided greater incentives for those who take the early risk.
Too many companies aren’t getting funded because they are mispriced. We see very early-stage companies seeking pre-seed capital at $15M and higher valuation caps. Many of those deals have no significant founder pedigree and questionable market size. They might be fundable, but not on those terms.
Liquidity delays are causing some investors to limit commitments of new funds until they see cash returns on their existing investments. While CAF is not in this predicament, we have experienced several situations over the past eighteen months where we had intent to invest but the company was unable to source the remainder of its required investor syndicate. Companies are going unfunded because of the liquidity stagnation in the system.
If an investor can access top quartile deal flow and multi-billion dollar outcome opportunities on a consistent basis the existing valuation environment might make sense. If they cannot consistently access top quartile deal flow, and we would argue that community-based angel groups cannot, investor outcomes and ultimately startup ecosystems will suffer.
Opinions
In general, the risks associated with pre-seed investing should bring reward such that a $50M exit improves overall fund metrics. If the pre-seed entry point is $10M - $15M a $50M exit produces something like a 2.0x - 2.5x outcome after dilution, which is insufficient.
CAF members are emotionally inclined to prefer pre-seed to seed stage investing, but the economics are pulling us in the opposite direction. The result might be CAF exhibiting increased price sensitivity when evaluating pre-seed deals. Some founders or other marketplace participants may perceive this to be risk-averse behavior. Taking risks is something with which we are very comfortable. We are merely seeking to ensure that taking those risks isn’t accompanied by a reduction in our portfolio’s expected returns.
One of the benefits of taking early-stage investment risk is Qualified Small Business Stock (QSBS) tax treatment. As the required holding period for QSBS treatment only begins once the investor holds equity, the prevalent use of SAFEs at pre-seed makes it more difficult to realize this benefit. A return to priced equity deals at earlier stages would increase investor incentive to take the early-stage risk.
It is understood that when we argue for lower pre-seed valuations it comes across as self-serving. To be sure, it is to a certain degree. What we would add for context is that the time and effort that the two of us put into Charlotte Angel Fund has much more to do with our care for the purpose than for personal economic gain. As highlighted earlier, investors realizing appropriate financial returns are essential for a healthy startup environment. Absence of adequate investment returns will decrease the number of active investors and availability of capital, and in turn will decrease the number of funded startups and associated innovation.
The Charlotte startup ecosystem is stronger than ever. Thanks to all who play a part in that, including but not limited to ecosystem support organizations, mentors, founders, and investors. It is a privilege for us to be participants.
We remain steadfast in our intent to serve the founders, supporters, and investors who comprise the startup ecosystem in our region. The work will continue.
Greg Brown and Camille Cunningham